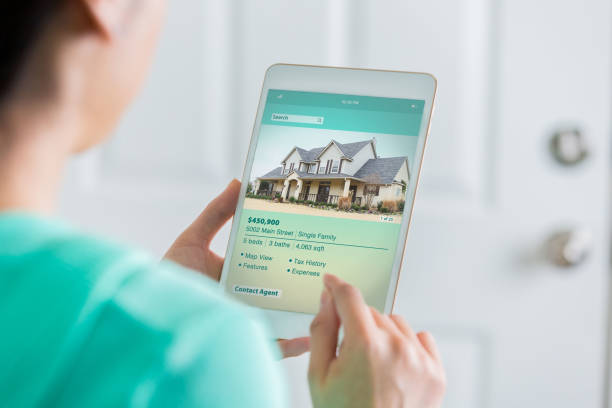
Which asking-price figure should guide your listing? There is no single market number that can replace a property-specific comparison. The latest reported period gives separate medians for new and active listings, and those figures answer different questions about competition. Use them as context, then adjust for condition, improvements, location, and buyer expectations before choosing your own strategy.
The July median list price for new listings was $408,990. The July median list price for active listings was $405,995. The new-listing median increased 2.5% month over month. The active-listing median decreased 2.2% month over month. The July median sold price was $402,308. The July market classification was balanced. New listings describe homes entering the market during July. Active listings describe homes active at the end of July. Sold listings describe completed July transactions. These groups should not be treated as interchangeable evidence.
New-listing pricing can show how sellers were entering the market. Active-listing pricing can show the competition buyers could see at period end. The differing movement reinforces that listing groups may tell different stories. Sold pricing provides a closing reference rather than a direct asking-price instruction. A balanced classification makes positioning against active competition especially relevant. Market medians cannot account for a home’s individual condition or improvements. The best price conversation connects all relevant groups without blending their purposes.
Start with comparable closed sales for a value anchor. Review active listings to understand the buyer’s alternatives. Use new listings to test how the market is being approached. Explain meaningful differences between your home and the comparison set. Decide whether your priority is speed, exposure, or maximum price. Prepare a review plan before making any later adjustment. Document the reasoning behind your launch price.